Analysis of the patent filings of the UK's Russell Group of Universities - Part II
This is the second of three articles examining the patent activities of the Russell Group of UK Universities.
- The first article examines the patent filings of The Russell Group of UK Universities as a whole, analysing patent growth, filing growth, international expansion of the patents worldwide
- The second article examines the patents filings of individual Universities, specifically analysing patent growth, filing growth, international expansion of the patents worldwide
- The third article examines the patent filings of individual Universities by technology classification analysis as well as citation analysis
The Russell Group of UK Universities
The Russell Group 24 members are world-class, research-intensive universities. They are unique institutions, each with their own history and ethos, but they share some distinguishing characteristics.
They are committed to maintaining the very best research, an outstanding teaching and learning experience and unrivalled links with local and national business and the public sector.
Who are the Russell Group of Universities
- University of Birmingham
- University of Bristol
- University of Cambridge
- Cardiff University
- Durham University
- University of Edinburgh
- University of Exeter
- University of Glasgow
- Imperial College London
- King's College London
- University of Leeds
- University of Liverpool
- London School of Economics
- University of Manchester
- Newcastle University
- University of Nottingham
- University of Oxford
- Queen Mary University of London
- Queen’s University Belfast
- University of Sheffield
- University of Southampton
- University College London
- University of Warwick
- University of York
Russell Group universities have huge social, economic and cultural impacts locally, across the UK and around the globe:
- They produce more than two-thirds of the world-leading research produced in UK universities and support more than 300,000 jobs across the country.
- Their economic output is more than £32 billion every year.
- In 2015-16, 417,000 undergraduates and 192,500 postgraduates were studying at a Russell Group university.
Our members attract students and staff from around the world and work with major multinational businesses and international organisations:
- Thirty-nine percent of academic staff and 34% of students are of non-UK nationality, attracted to our universities by the quality, relevance and reputation of the research groups and departments they join.
Russell Group members also have a strong role and influence within their regional and local communities, collaborate with businesses on joint research projects and supply highly-qualified and highly-motivated graduates to the local workforce.
source: The Russell Group Website
Individual Russell Group Universities have published between 339 and 5243 patents over the past decade
There is a big difference between Universities in terms of published patents. The top four Universities - Oxford, Imperial, Cambridge and University College London - account for 15,565 published patents or 46% of all the published patents of the Russell Group. The four Universities with the least number of published patents - University of Exeter, Durham University, University of York and Newcastle University - account for 1,932 published patents or 6% of all the published patents of the Russell Group.
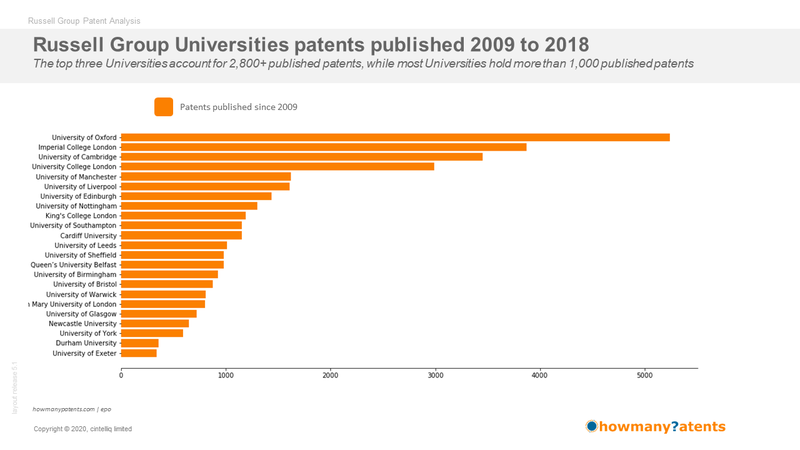
Ranking of Russell Group Universities
| rank | universities | # |
|---|---|---|
| 1 | University of Oxford | 5243 |
| 2 | Imperial College London | 3875 |
| 3 | University of Cambridge | 3456 |
| 4 | University College London | 2991 |
| 5 | University of Manchester | 1620 |
| 6 | University of Liverpool | 1612 |
| 7 | University of Edinburgh | 1438 |
| 8 | University of Nottingham | 1298 |
| 9 | King's College London | 1189 |
| 10 | University of Southampton | 1151 |
| 11 | Cardiff University | 1150 |
| 12 | University of Leeds | 1012 |
| 13 | University of Sheffield | 980 |
| 14 | Queen’s University Belfast | 980 |
| 15 | University of Birmingham | 925 |
| 16 | University of Bristol | 875 |
| 17 | University of Warwick | 808 |
| 18 | Queen Mary University of London | 804 |
| 19 | University of Glasgow | 721 |
| 20 | Newcastle University | 646 |
| 21 | University of York | 592 |
| 22 | Durham University | 355 |
| 23 | University of Exeter | 339 |
note: London School of Economics does not appear to have any patents published in the period 2009 - 2018.
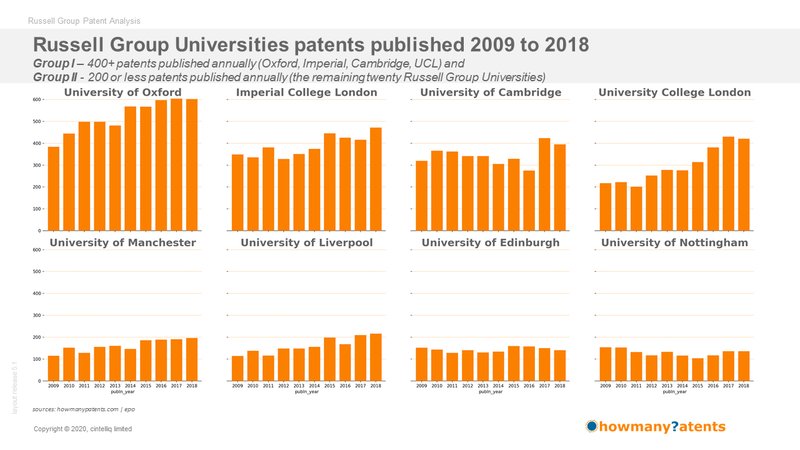
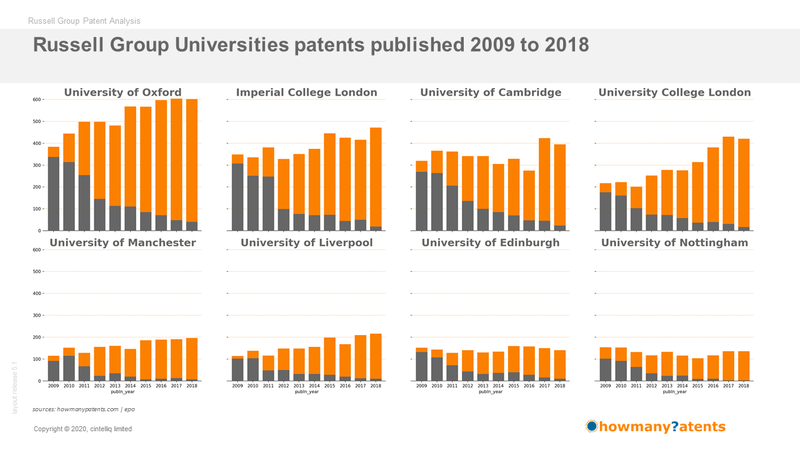
Published patents rise and fall over the decade
All Russell Group Universities are seeing year-on-year growth for published patents overall. These published patents are a combination of new inventions, international filings and granted patents. For the majority of the Russell Group Universities the number of patents published year-on-year have risen and fallen over the decade.
Looking the individual University filings show large variations in numbers of published patents per year. For some there are clear growth in published patents year-on-year while others show steady and constant patents published annually.
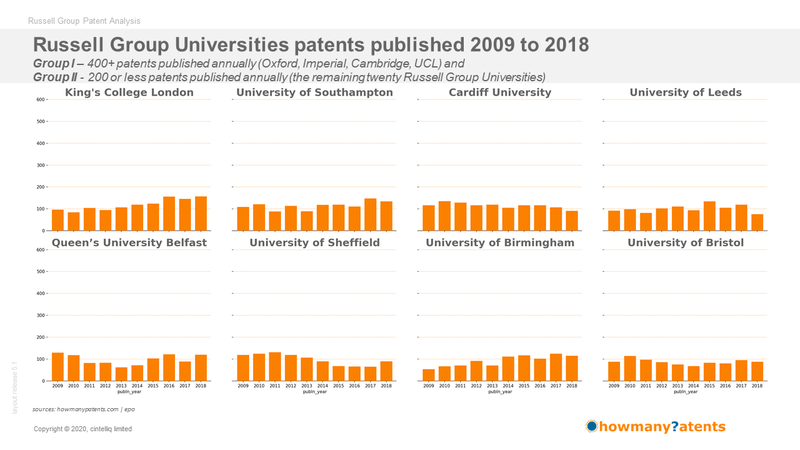
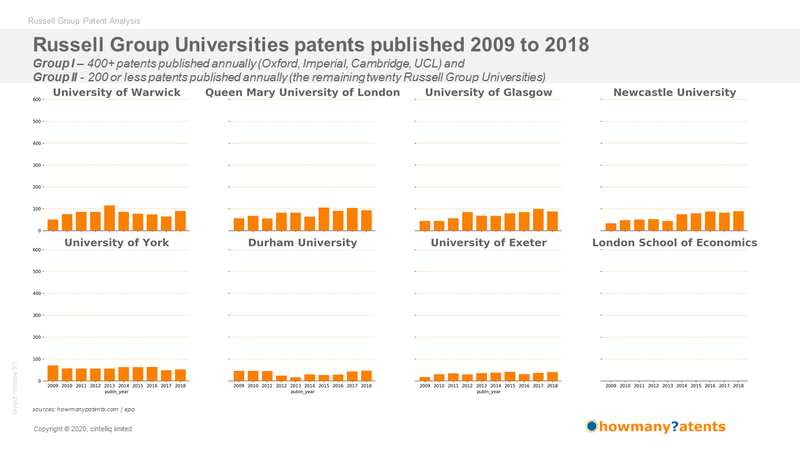
Two clear groups
Group I - those with more than 400 published patents annually
- University of Oxford | Imperial College London | University of Cambridge | University College London
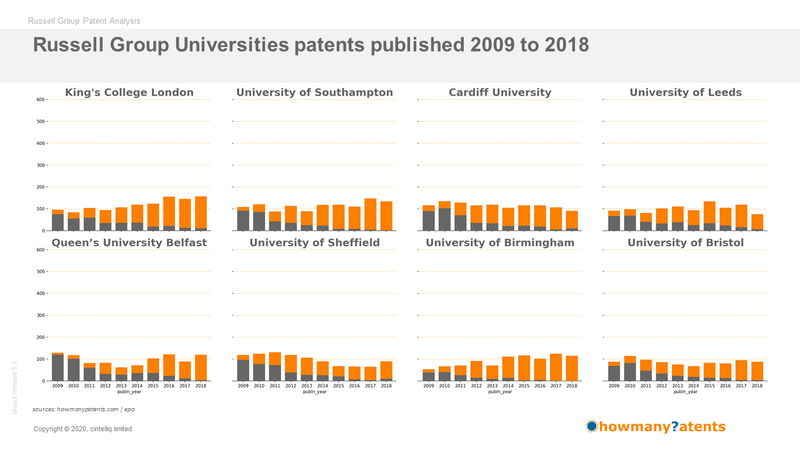
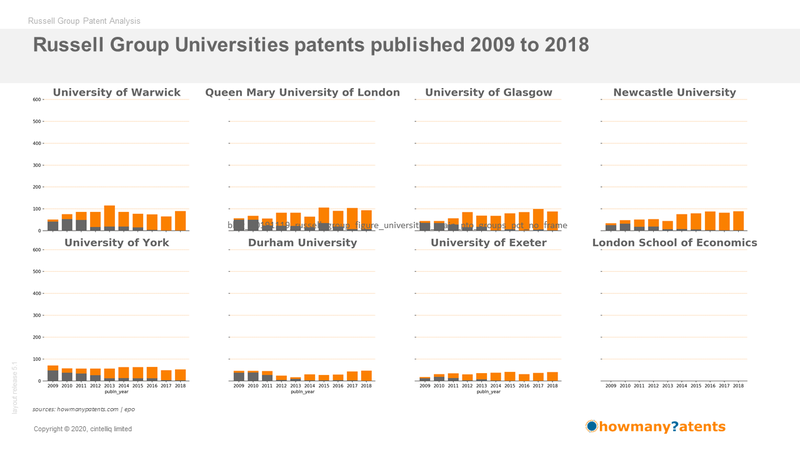
Group II - those with 200 or less published patents annually
- University of Manchester | University of Liverpool | University of Edinburgh | University of Nottingham | King's College London | University of Southampton | Cardiff University | University of Leeds | Queen’s University Belfast | University of Sheffield | University of Birmingham | University of Bristol | University of Warwick | Queen Mary University of London | University of Glasgow | Newcastle University | University of York | Durham University | University of Exeter
note: London School of Economics does not appear to have any patents published in the period 2009 - 2018.
Buy the full report
The report examines in-depth the ten-year patent filing activities of
The Russell Group of Universities as a whole and the 24 individual Universities.
The report is priced at £ 3,999
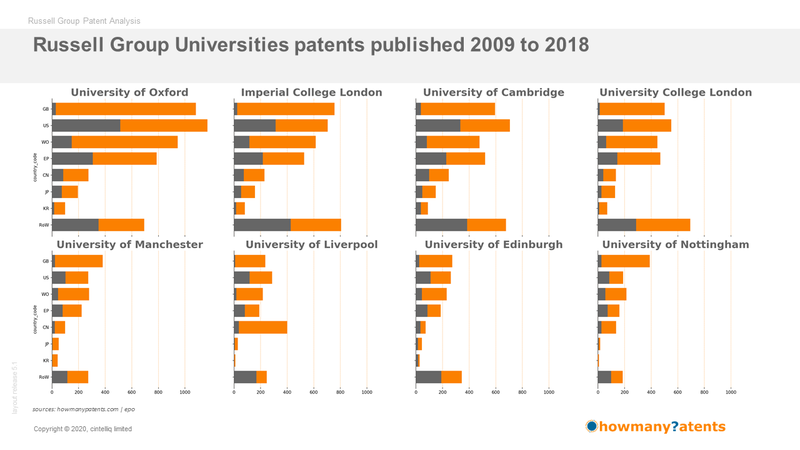
Patent published per year - showing earliest filings
Analysing published patents in terms of those filed before 2009 and those filed since show how many of the published patents have been recent inventions and those which are extensions of older inventions.
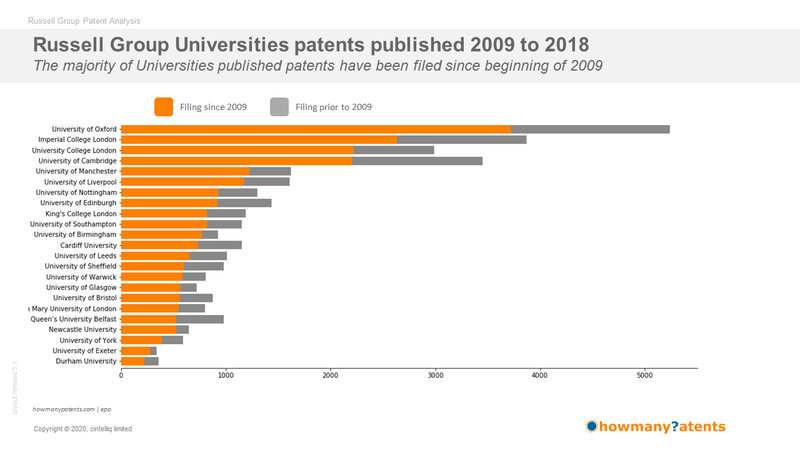
Published patents filed before 2009 (coloured grey in the bar charts below) represent fewer and fewer published patents as the decade progresses. Those published patents filed since 2009 (coloured orange in the bar chart below) are growing year-on-year. Patents filed since the beginning of 2009 are a mixture of initial patent filings - patents filed mainly in GB (the home and priority country) - and subsequent international filings as the patent holders seek international protection in the countries considered to be commercially relevant for the invention.
note: London School of Economics does not appear to have any patents published in the period 2009 - 2018.
| GB | US | JP | KR | CN | EP | WO | RoW | |
|---|---|---|---|---|---|---|---|---|
| University of Oxford | 1082 | 1169 | 195 | 98 | 274 | 787 | 945 | 693 |
| Imperial College London | 756 | 704 | 157 | 81 | 229 | 528 | 615 | 805 |
| University of Cambridge | 594 | 706 | 148 | 89 | 247 | 519 | 477 | 676 |
| University College London | 501 | 551 | 128 | 69 | 135 | 468 | 446 | 693 |
| University of Manchester | 382 | 272 | 50 | 43 | 98 | 223 | 279 | 273 |
| University of Liverpool | 236 | 286 | 28 | 10 | 400 | 190 | 216 | 246 |
| University of Edinburgh | 273 | 262 | 45 | 27 | 72 | 185 | 230 | 344 |
| University of Nottingham | 389 | 189 | 16 | 7 | 136 | 161 | 214 | 186 |
| King's College London | 231 | 244 | 54 | 10 | 38 | 180 | 209 | 223 |
| University of Southampton | 329 | 235 | 29 | 17 | 53 | 132 | 171 | 185 |
| Cardiff University | 221 | 204 | 33 | 6 | 53 | 169 | 141 | 323 |
| University of Leeds | 197 | 215 | 32 | 12 | 68 | 144 | 134 | 210 |
| Queen’s University Belfast | 135 | 163 | 34 | 18 | 78 | 136 | 128 | 288 |
| University of Sheffield | 272 | 137 | 30 | 13 | 49 | 121 | 187 | 171 |
| University of Birmingham | 187 | 174 | 38 | 11 | 61 | 145 | 173 | 136 |
| University of Bristol | 235 | 164 | 34 | 6 | 35 | 99 | 122 | 180 |
| University of Warwick | 298 | 117 | 16 | 8 | 39 | 83 | 128 | 119 |
| Queen Mary University of London | 147 | 163 | 43 | 10 | 39 | 134 | 138 | 130 |
| University of Glasgow | 119 | 120 | 39 | 11 | 49 | 99 | 123 | 161 |
| Newcastle University | 169 | 103 | 17 | 8 | 41 | 93 | 113 | 102 |
| University of York | 156 | 115 | 14 | 11 | 29 | 80 | 97 | 90 |
| Durham University | 83 | 86 | 6 | 5 | 8 | 53 | 67 | 47 |
| University of Exeter | 88 | 59 | 8 | 3 | 16 | 53 | 72 | 40 |
| Total | 7080 | 6438 | 1194 | 573 | 2247 | 4782 | 5425 | 6321 |
Do you like this article?
Sign-up to receive an email when part III is published
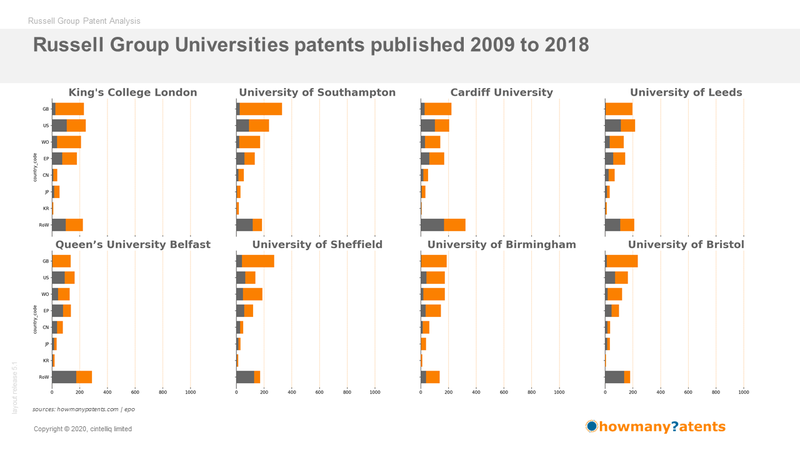
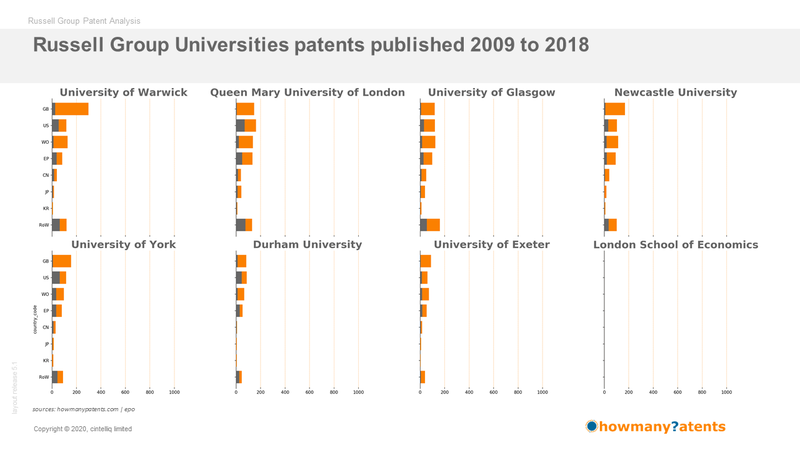
Patents by Publication Country
All Russell Group Universities seek international protection of their intellectual property. Country filings by Universities show similar profile of filing in GB the home country and filing internationally. Outside of GB the many patents are filed in WO and EP - and more specifically US, JP, CN and KR. The RoW (rest of the world) accounts for fewer patent filings - suggesting Universities are more focused on the main patent offices - US, EP, JP, CN, and KR.
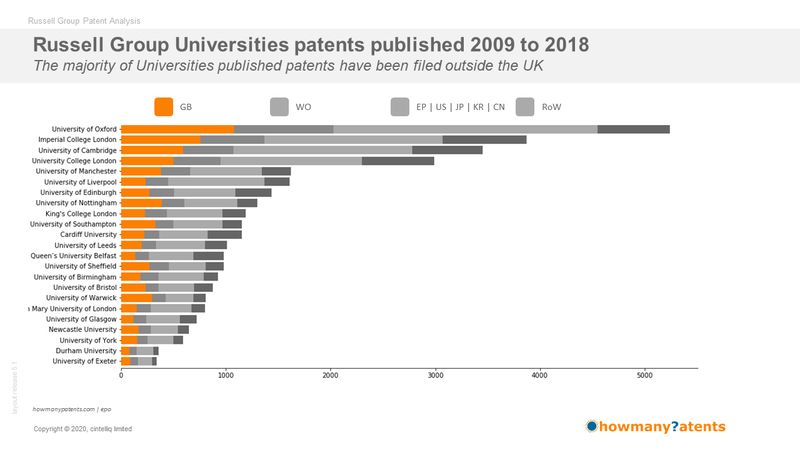
Most Universities file in the GB and this often represents the biggest country share of published patents. This is understandable as these are UK based Universities and make their initial filings in the home country (GB). Eight Universities have US filings larger than their GB filings. The University of Liverpool has filed more patents in China(CN) than they have in any other country.

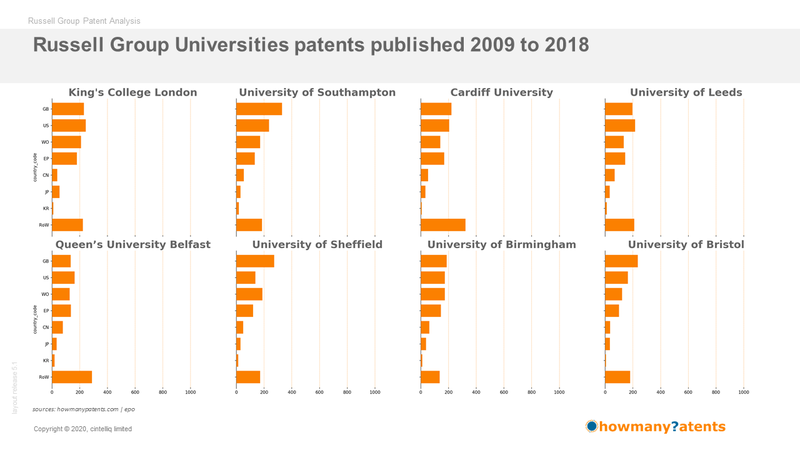
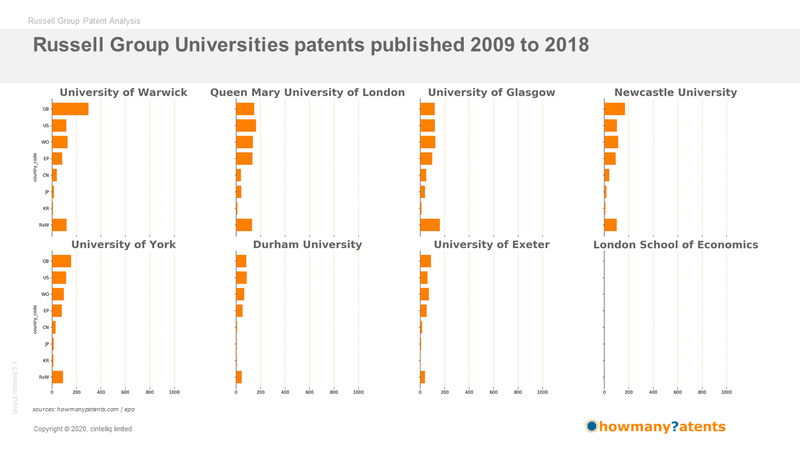
For most Universities home country filings - those listed as GB - account for between 14% and 37% with the majority between 17% and 26% of their published patents.
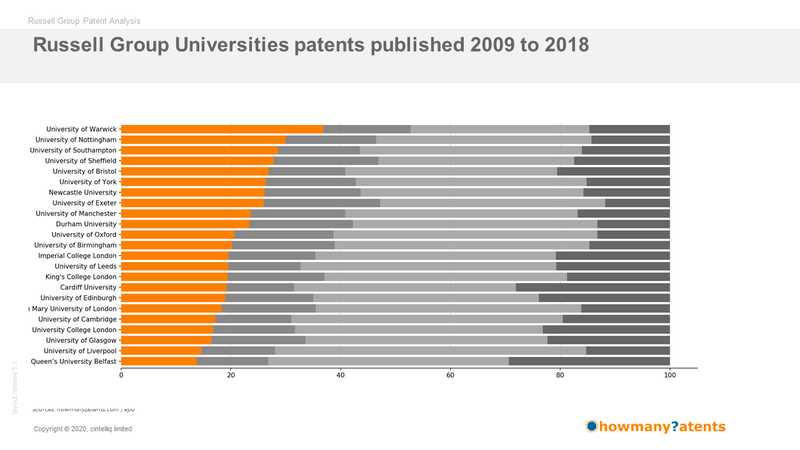
Patents by Publication Country - showing earliest filings
Analysing published patents in terms of their filing dates reveals the bulk of GB published patents have been filed since the beginning of 2009, with many published patents filed in EP, US, JP, CN and KR filed prior to 2009. Published patents in WO (PCT) see most of them filed since 2009 - this is probably due them being closely linked to the GB filings and can be considered a prelude to filing patents internationally. Here we also see the University of Liverpool has filed most of its CN patents since 2009.
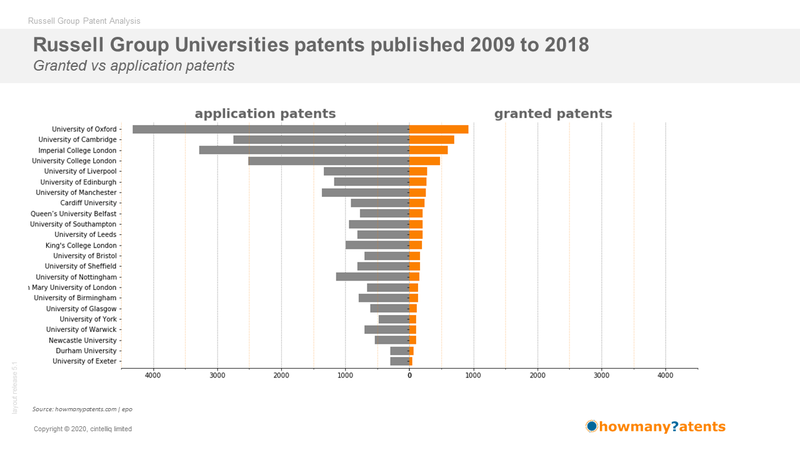
Granted patents
Ranking the Russell Group of Universities in terms of their granted patents reveals those ranked high on the list are not always those with an eqaully large number of application patents.
Patent families
Analysing published patents in terms of the number of them while a convenient means to assess the size and breadth of an organisation's patent portfolio does not account for the number of inventions in a patent portfolio. Simply put the number of patents does not equal the number of inventions.
An another approach more suited to counting inventions rather than simple published patents is to analyse patent portfolio in term of patent families. What do we mean by patent families.
The actual definition we use is the EPO definition of patent families:
"A simple patent family is a collection of patent documents that are considered to cover a single invention. The technical content covered by the applications is considered to be identical. Members of a simple patent family will all have exactly the same priorities."
See https://www.epo.org/searching-for-patents/helpful-resources/first-time-here/patent-families/docdb.html
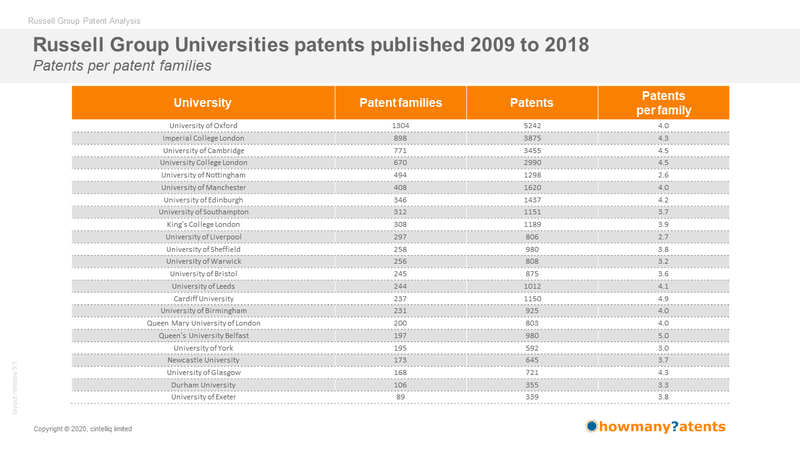
Our analysis of the Russell Group of Universities shows the range of patents families to be between 89 to 1304. So as an invention is published internationally (in more countries) the number of patents in a specific patent family will increase. Our analysis shows Russell Group Universities average between between 2.6 patents per family and 5.0 patents per family.
Buy the full report
The report examines in-depth the ten-year patent filing activities of
The Russell Group of Universities as a whole and the 24 individual Universities.
The report is priced at £ 3,999
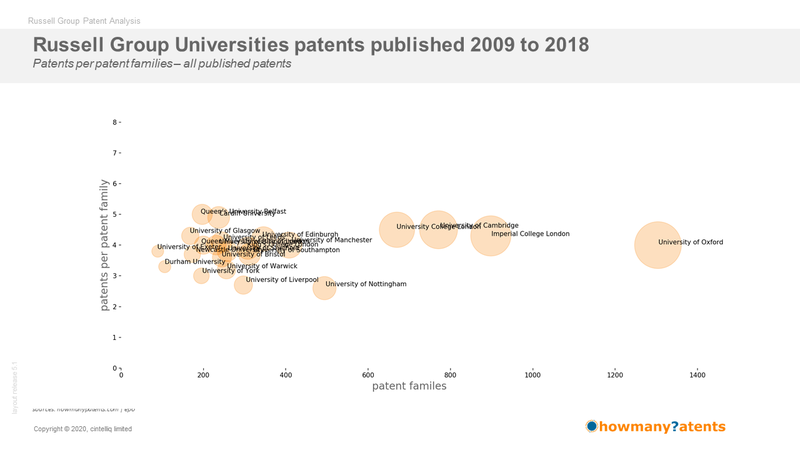
There number of patents per patent family lies between 3.0 and 4.5 for all published patents
The number of patents per patent family held by the Universities vary - there is a clear clustering around 3.0 - 4.5 patents per patent family. Further analysis suggests irrespective of the number of patent families held by a University the average the number of patents per patent family falls within this range. The Universities with large patent families are still within this range. From reviews the charts below visually we could be argued that as the number of patent families held by a University grows the number of patents per family tends towards 4.0.
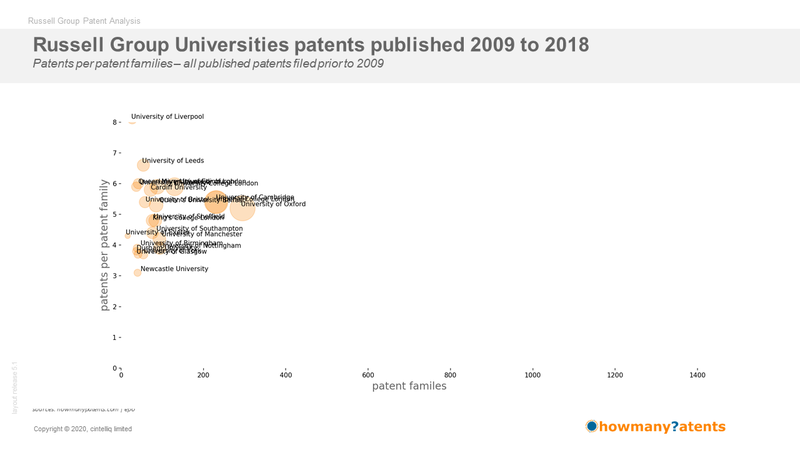
There number of patents per patent family for published patents with early priority filing dates have more patents per family
Analysing patent families with early priority dates - those filed before 2009 - have higher number of patents per patent family. Here we see the range falls with 3.0 and 7.0. An explanation for this could be there are a larger number patents per patent because this family has an invention considered to be worth protecting in many countries and many of the applications have been granted.
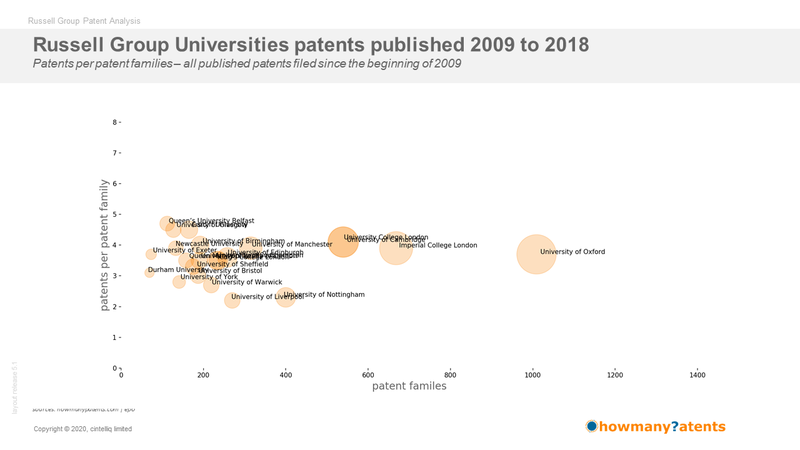
There number of patents per patent family for published patents with filing date since 2009 is similar to the overall number of patents per family
You may be interested in parts II and III:
Analysis of the patent filings of the UK's Russell Group of Universities - Part I
- The first article examines the patent filings of The Russell Group of UK Universities as a whole, analysing patent growth, filing growth, international expansion of the patents worldwide
Analysis of the patent filings of the UK's Russell Group of Universities - Part III
- The third article examines the patent filings of individual Universities by technology classification analysis as well as citation analysis
Do you like this article?
Sign-up to receive an email when part III is published